Tiles in the Projects screen can be clicked to access more detail.

A click on ACTIVITIES will take you to the project plan.
Clicks on any other areas of project tiles will take you to the project overview for that project.
The project overview screen

This screen is a dashboard of project information, providing access to the following:
Business objectives
Here you can see this project's link to any business objective(s). Click to see the objective detail, including key results and linked outcomes.

Outcomes
If there are any, the next outcomes are available in this tile and you can scroll through to see them all. If no objectives are present they need to be linked. See the guide to linking activities for more.
Project status
In this tile, you can see the overall project RAG status, as well as statuses under separate headings: PROGRESS VS PLAN, COSTS, BENEFITS, RISKS & ISSUES, RESOURCES, CUSTOMERS. There is also space for some high-level commentary on progress and other updates. Note that the information captured here is entered manually.

By clicking VIEW AND EDIT STATUS, you can change the overall RAG status and the individual RAG statuses. You can also add a summary, explaining any reasoning by the statuses.

Activity overview
What are the statuses of the activities in the project? This chart provides an at-a-glance view of performance.

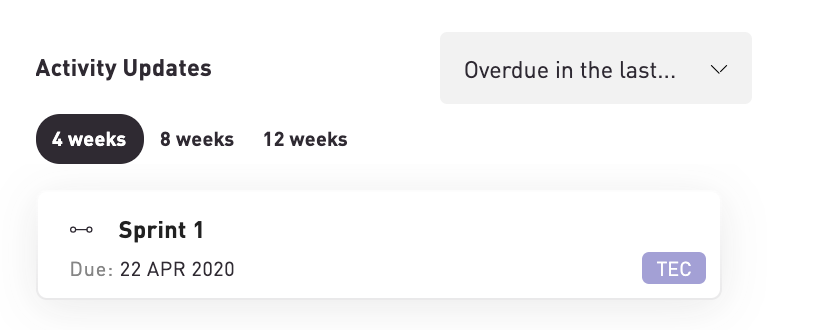
Activity updates
This a feed of all activities across the project. You can adjust the view to see 4, 8 and 12 weeks. And you can filter on overdue, complete and due. Click each activity in the feed to see it in the plan.
Team sentiment
This chart is a trending view of team sentiment, as expressed by the project team members. See How do I assess team sentiment? to find out more.

Project health
Here can you can view your project’s current health score and a snapshot of the last 8 weeks performance. See How do I assess project health? to find out more.

Project slippage
This a projection of any project slippage (% probability of slippage of planned v projected end date.)

Click the tile to see detail on the estimated slippage and suggested further actions to mitigate any risk.
